Hunger Facts & Stats
One key to ending food insecurity is better educating ourselves and one another about the nature of need and the reality of those who find themselves struggling to provide for their household’s basic needs.
Not everyone simply needs food. Not everyone in need is simply underemployed.
There are some common misconceptions that persist around the subject of need and the nature of food insecurity. These misunderstandings can create obstacles to helping our neighbors out of the challenging circumstances that they may find themselves in. Fortunately, we’ve learned a lot of helpful information that is allowing us to really make a difference in the lives of those we serve in the bi-state area.
The bottom line is that while hunger can affect anyone, anyone can affect hunger. Often, the first step in having a positive impact is understanding.
Hunger in Missouri and Illinois
Which would you choose to go without?
ONE in every SEVEN people in Eastern Missouri and Southwestern Illinois face hunger. Putting food on the table for their families often creates a tough choice: A meal or electricity, a meal or medication, a meal or gas for the car.
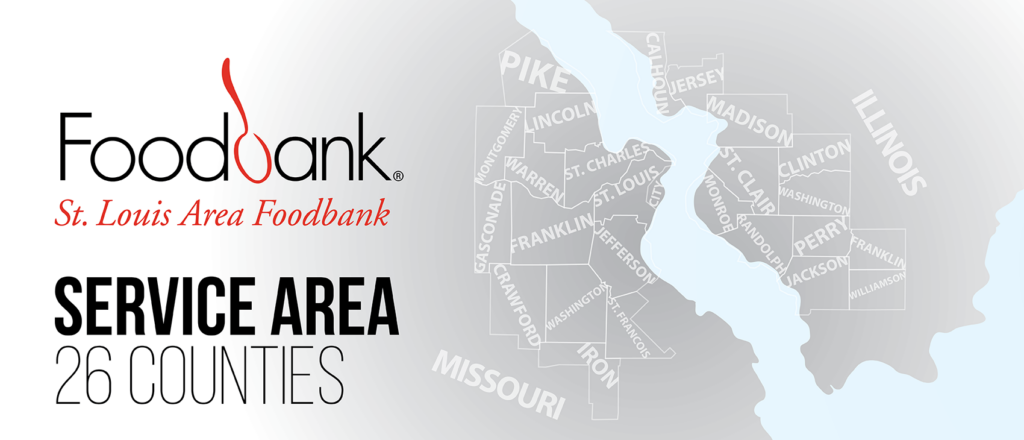
In 2021, the University of Missouri Interdisciplinary Center for Food Security conducted Food Assistance and Hunger in the Heartland 2021. This study aimed to better understand the characteristics of food pantries and food pantry clients across the 26 counties served by the St. Louis Area Foodbank.
According to this study:
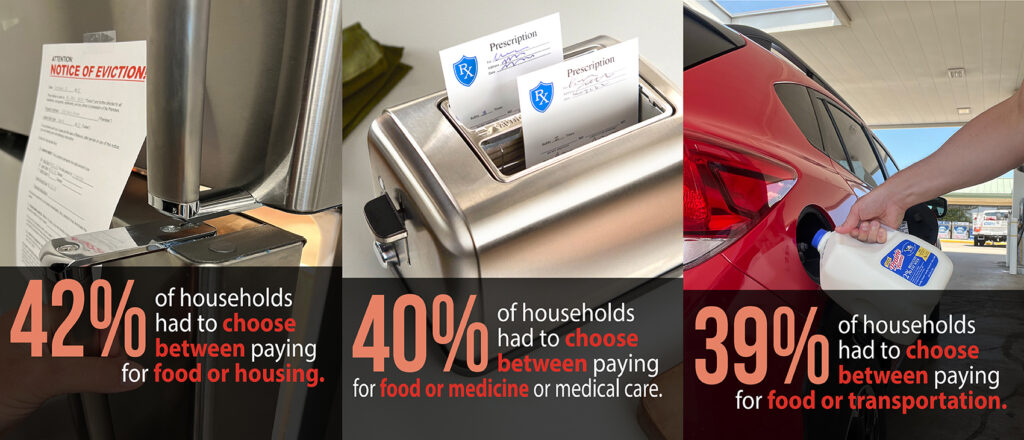
42% of households had to choose between paying for food or housing.
40% of households had to choose between paying for food. or medicine or medical care.
39% of households had to choose between paying for food or transportation.


Key findings from Feeding America’s most recent Map the Meal Gap* study:
- 1 in 7 adults in the bi-state region is food insecure.
- 1 in 6 children in the bi-state region is food insecure. This rate varies across the different counties we serve, ranging from a low of 8% in Monroe County, IL, to a high of 30.6% in St. Louis City, MO.
- Food insecurity impacts communities in every county, parish, and congressional district in the U.S. Food insecurity is experienced by people from all backgrounds and demographics, but disparities exist.
- Nationwide, nearly 9 out of 10 high food insecurity counties are rural, indicating regional disparities. This is true in Missouri and Illinois, which see high levels of food insecurity across our rural counties, such as Iron County, MO.
- The food insecurity rate among seniors age 60+ in the St. Louis metro area is 5.6%/.
- Food insecurity rates among older adults age 50-59 in the St. Louis metro area are 10.4%.
To learn how food insecurity impacts your community, visit FeedingAmerica.org/MaptheMealGap.
*Map the Meal Gap uses publicly available data from USDA Economic Research Service, U.S. Census Bureau and Bureau of Labor Statistics.